
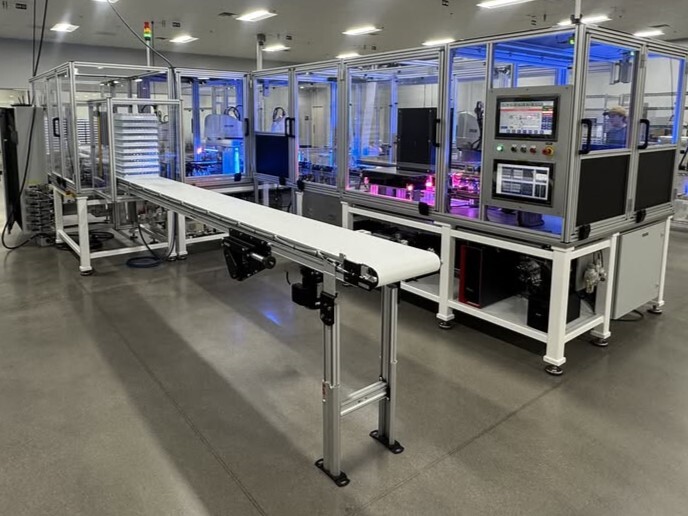
Automation systems come with a generalized promise of efficiency…but if you’re an industry vet, you’re likely keen to know: where’s the ROI? Where’s the proof? Even if a custom automated vision inspection system passes the eye test (pun intended), it takes numbers to defend a big tech investment for upgrades on the line.
The proof for any automation system comes from a before-and-after comparison of measurables. We’re talking labor hours, cycle time, scrap, inspection failures, machine utilization and output per shift. If those numerically improve, there’s your path (and timeline) to ROI.
EVIDENCE OF ROI FOR CUSTOM AUTOMATION IS NOT HARD TO FIND
There’s plenty of public manufacturing data to turn to for some benchmarks of what’s possible.
For example, take one recent 2025 case study from NIST the National Institute of Standards and Technology by the U.S. Department of Commerce
- PARTS HANDLING: A maker of parts for precision rifles automated the parts handling functions of a five-axis machine, which the company said “allowed the machine to continue running throughout the remaining 16 hours of the day.” They reported an eight-month ROI. The case study recorded $750,000 in cost savings and $500,000 in increased or retained sales — sure signs of the value of parts handling automation.
Other NIST studies show excellent returns, too, in various areas of the line:
- PALLETIZING: NIST documented a robotic palletizing project at HoneyBaked Ham with an eight-month payback, $220,000 in new investment and $200,000 in cost savings. The plant manager reported that the robotic system had “exceeded all of our performance goals.” Read the NIST case study here.
- DATA COLLECTION: At Enviro Tech, integrating PLC data directly with ERP and quality management systems helped eliminate manual data entry, improve traceability and reduce human error. NIST reports the project involved $29,500 in information systems investment and generated $421,450 in cost savings, demonstrating the significant ROI possible for automating manufacturing data collection and system integration. NIST documented the project here.
These are all anecdotal figures, yes, but are textbook examples of the places where financial return can be found: additional productive machine hours with higher throughput and fewer quality failures.
HOW TO PROVE AUTOMATION ROI
Are you evaluating custom automation solutions for a potential project of your own? Start with the current-state cost of the process.
For a manufacturing cell, map the process and do some tracking to establish a representative baseline. Here are some ideas to get you started:
- Measure direct labor hours per shift.
- Record scrap and rework.
- Capture cycle time, downtime and inspection time.
- Document actual units produced.
Next, calculate the expected state of the process after automation is in place. To find your time to ROI, you have to figure out how long it will take for the operational benefits of the automation to create more financial value than the initial cost of installing the automation. Here’s the formula:
Payback period = total installed automation cost ÷ annual financial benefit
The automation cost will be known to you up front, through your vendor and/or installer. Make sure to use the complete installed cost — that includes the machine as well as integration, custom tooling, controls, guarding, installation and training.
However, you also need to know the annual financial benefit. Here’s the formula to figure that out:
Annual financial benefit = labor savings + added contribution from higher output + scrap/rework savings + avoided downtime and quality costs
These contributing elements can all be calculated by tracking the process after automation and comparing to the figures you tracked on the line prior to automation. Even before you have the automation installed, it may be possible to find a ballpark for your results via educated estimates.
LOOK FOR AUTOMATION ROI ACROSS THE ENTIRE CELL
The largest value is in turnkey, start-to-finish automation cells. End-to-end systems can even produce returns that a station-level calculation might miss.
There’s limited value in faster robotic handling, for instance, if inspection stations keep the same pace as before and remain the line constraint. But if you’re able to integrate inspection processes with reject handling and production data, all in one automation project, you’re seeing gains in all areas at once.
Broader industry research also supports the economics of custom automation systems. Look no further than this MIT Science Policy Review, which found in 2023 that automation became cost-effective after 454 days for one robot and 137 days when multiple robots replaced twice as much manual work. The authors described the payback period as “surprisingly short.”
PROVE THE RETURN WITH PRODUCTION DATA
If you’re the person responsible for proving automation ROI for manufacturers before a big business decision, the strongest evidence you can give will be specific and auditable. Take time to consult with your automation provider to establish the baseline, price the complete system and then make sure you continue tracking the same production metrics after commissioning is complete.
Jerit Automation works with you to define those numbers as the system is still being engineered. Talk to one of our automation experts to take a look at the current process and identify the biggest opportunities where labor and cycle time are being consumed. We design custom automation solutions to meet measurable production requirements with provable ROI.
Let’s talk to establish a concrete basis for your proposed automation investment. Contact Jerit Automation today to share the details of your project and the production targets behind your ROI calculation.
FAQS
What is automation ROI?
Automation ROI compares the financial benefit created by an automated process with the complete cost of designing, installing and operating the system.
How do you calculate automation ROI for manufacturers?
Measure annual savings and additional contribution generated by the system against the total installed investment. Manufacturers also commonly calculate payback period to determine how long the system takes to recover its initial cost.
What costs belong in an automation ROI calculation?
Include equipment, engineering, system integration, controls, tooling, guarding, installation, training and expected maintenance costs.
What production metrics should be measured before automation?
Useful baseline metrics include cycle time, units per shift, labor hours, scrap, rework, inspection failures, machine utilization and downtime.
How can increased throughput contribute to process automation ROI?
Additional throughput creates financial value when the manufacturer has demand for the added capacity. The calculation should use the contribution generated by additional saleable output rather than treating every additional unit as revenue.
How does quality affect test automation ROI?
Automated testing and inspection can reduce escapes, scrap and rework while collecting consistent production data. Those savings should be measured separately from labor or throughput improvements.
What affects robotic process automation ROI in manufacturing?
Robot utilization, cycle time, labor requirements, tooling, integration costs and the number of productive hours available each year all affect robotic process automation ROI.
Why can fully integrated systems produce stronger automation ROI?
Integrated systems can address several constraints within the same cell. Robotic handling may increase throughput while automated inspection reduces quality failures and connected controls reduce manual data handling, allowing one project to create measurable returns in several parts of production.